Leading commodities
| Commodity | Production (t) | Rank in Lampung |
|---|---|---|
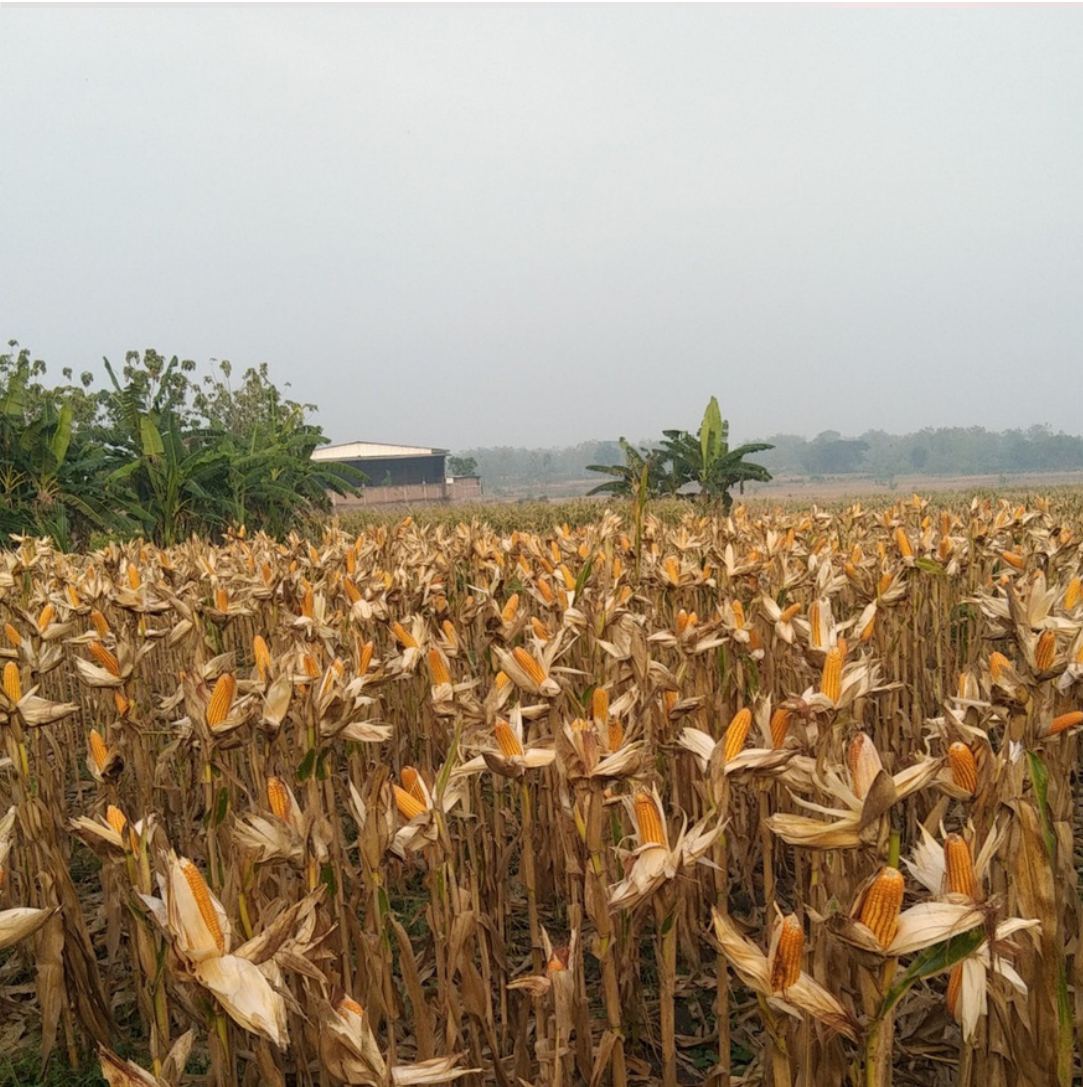
| Corn | 599,992 | #1 |
| Vannamei Shrimp — Bar chart 14.631; map label prints 14.433 — bar value used | 14,631 | #1 |
| Coconut | 20,403 | #2 |
| Paddy | 460,853 | #3 |
| Cacao | 7,015 | #3 |
| Tiger (Windu) Shrimp — Map label | 197 | — |
Production of leading commodities
tons
Source: Disperindag 2026 via FOILA 2026 p.11–18
Investment opportunities

ITERA Commercial Area (Kawasan Komersil ITERA)
Commercial & Real Estate
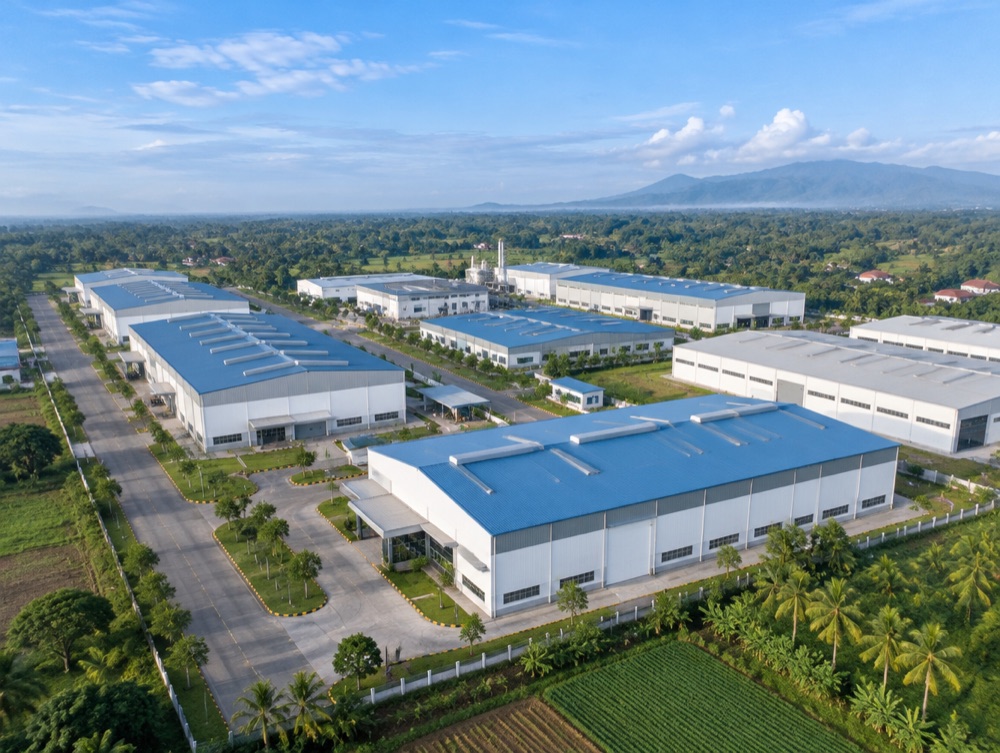
Lampung Industrial Estate II (KAIL II)
Industrial Estate
Lampung Sport Center (LSC)
Sports & Mixed-use

Integrated Tourism Area (KWT) — Lampung Selatan
Tourism
Industrial Estate II Tanjung Bintang
Industrial Estate
Katibung Industrial Estate
Industrial Estate
Gedung Wani Production Area
Industrial Estate
Energy & water
geothermal
Gunung Rajabasa
283 MW · MoU signed 2026 (Supreme Energy)
waste to energy
Kotabaru
potential / success story (PSEL)
Tourism
beach
Rio The Beach
Offering the beauty of Lampung's beaches with a Balinese feel · 68.3 km from Bandar Lampung
beach
Batok Kelapa
Clean, modern beach with a 4.9 rating · 55 km from Bandar Lampung
Workforce, land price, demographics and investment-realisation data per regency are not yet in the database. They will be added in phase 2 (BPS, Disnaker, DPMPTSP).
Explore South Lampung with us
Our Investor Desk helps you with site visits, data requests, permits and introductions to local partners — free of charge.